To check if your ETFs overlap, compare the holdings of each pair of funds by weight, taking the smaller of the two weights for every stock both funds own and adding them up. Then look through all your funds together to see how much of each company you own across every account. Astor, a personal investing agent from an SEC-registered investment adviser, does that second step across the accounts you connect and gives you personalized advice on what to do about it.
Overlap isn’t a problem in itself. It matters when it leaves more of your money in the same few companies than you meant to have there. Below we cover how to measure it, how much is too much and what an overlap number can’t tell you, with every outside fact checked on November 20, 2026.
What does it mean when two ETFs overlap?
Two ETFs overlap when some of the money in each is invested in the same holdings. If one fund puts 7% of its money in a stock and another puts 5% in the same stock, the two overlap by 5 percentage points on it. Add that up across every holding both funds own and you get the overlap by weight, from 0% when they share nothing to 100% when they’re the same portfolio.
Weight is the number to use, not the count of shared stocks. Vanguard’s Total Stock Market ETF (VTI) held 3,519 stocks on September 30, 2026, and its S&P 500 ETF (VOO) held 505. By count, VOO’s stocks are about a seventh of VTI’s, but by weight they’re most of it, because the S&P 500 covers about 80% of the value of the US stock market, according to S&P Dow Jones Indices.
How do you check overlap between two ETFs?
There are two ways to do it.
- Use an overlap calculator. Our free ETF overlap checker takes two to four tickers and shows the overlap by weight, how many holdings the funds share and which shared holdings are largest. ETF Research Center’s overlap tool compares two equity ETFs at a time and shows the top five shared holdings without an account.
- Read the holdings yourself. The SEC requires ETFs that operate under its ETF rule to post their portfolio holdings on their website each business day before the market opens. iShares, for example, offers a download of the latest holdings for IVV. Download both lists, match the holdings and add up the smaller weight of each one both funds own.
FINRA suggests the same habit in its guide to concentration risk: read each fund’s prospectus or website to see whether your funds hold positions in similar companies. A calculator doesn’t know how much of each fund you hold, which matters more.
How much ETF overlap is too much?
There’s no single cutoff, because overlap describes your funds, not your goals. What matters is whether the second fund adds anything you wanted that the first one didn’t already give you.
Our checker labels results this way, and it’s a reasonable way to read the number.
| Overlap by weight | What it usually means |
|---|---|
| 80% or more | The funds hold close to the same portfolio. |
| 50% to 80% | Much of the money is in the same companies, often the largest ones. |
| 20% to 50% | The funds share a core but take it in different directions, like growth and dividend funds. |
| Under 20% | The funds mostly hold different things. |
Common pairs show the pattern. VOO and IVV both track the S&P 500, so they overlap almost completely. Invesco’s QQQ tracks the Nasdaq-100, which Nasdaq describes as 100 of the largest non-financial companies listed on its exchange, so it shares many of the biggest names with an S&P 500 fund while holding no banks or insurers.
High overlap isn’t automatically a mistake, since some people add a technology fund to a broad fund on purpose. The check makes sure a tilt like that is a choice and not an accident.
How do you check overlap across your whole portfolio?
A pairwise number doesn’t tell you how much you own of anything. A 90% overlap between a fund that’s half your portfolio and one that’s 2% of it barely changes your exposure, while a 40% overlap between your two largest funds can matter a lot.
So the more useful check is your total exposure to each company. For every company, multiply its weight inside each fund by that fund’s share of your portfolio, then add any shares you own directly.
Say a fund is 40% of your portfolio and a company is 7% of that fund. Through that fund alone you have 2.8% of your money in the company. If a second fund that’s 20% of your portfolio holds the company at 12%, that adds 2.4%, and shares you bought directly worth 1.5% of your portfolio bring the total to 6.7%, even though no single line on your statement says so.
If you do this for your 10 largest companies, three things usually stand out.
- Single-company concentration. A company you’d never buy at 7% on its own can reach that through three funds.
- A top-heavy portfolio. VOO’s 10 largest holdings were 40.6% of the fund on September 30, 2026, and Vanguard’s technology ETF (VGT) put 63.7% in its top 10. The more of a fund like VGT you hold, the more of your money rides on a few names.
- Sector tilts. Add up your exposure by sector and compare it with a broad market fund to see where a growth or sector fund pushed you further than you planned.
The hard part is gathering the data. Your 401(k), IRA and brokerage account each show only their own holdings, and none of them looks inside the funds for you.
What can an overlap number miss?
An overlap number says nothing about what a fund leaves out, so adding a Nasdaq-100 fund to a total market fund shifts your sector mix more than a moderate overlap number suggests.
Low overlap also doesn’t mean low risk. A semiconductor fund and a software fund may share few companies and still rise and fall together, because both depend on the same appetite for technology stocks. FINRA notes that spreading money across funds can help, but it’s often not enough to avoid concentration risk on its own.
Overlap is also a snapshot. Invesco says QQQ and its index are rebalanced quarterly and reconstituted annually, and weights move with prices every day, so an overlap number from a year ago may be well off. Recheck when you add a fund, or once a year with the rest of your portfolio review.
How does Astor help with ETF overlap?
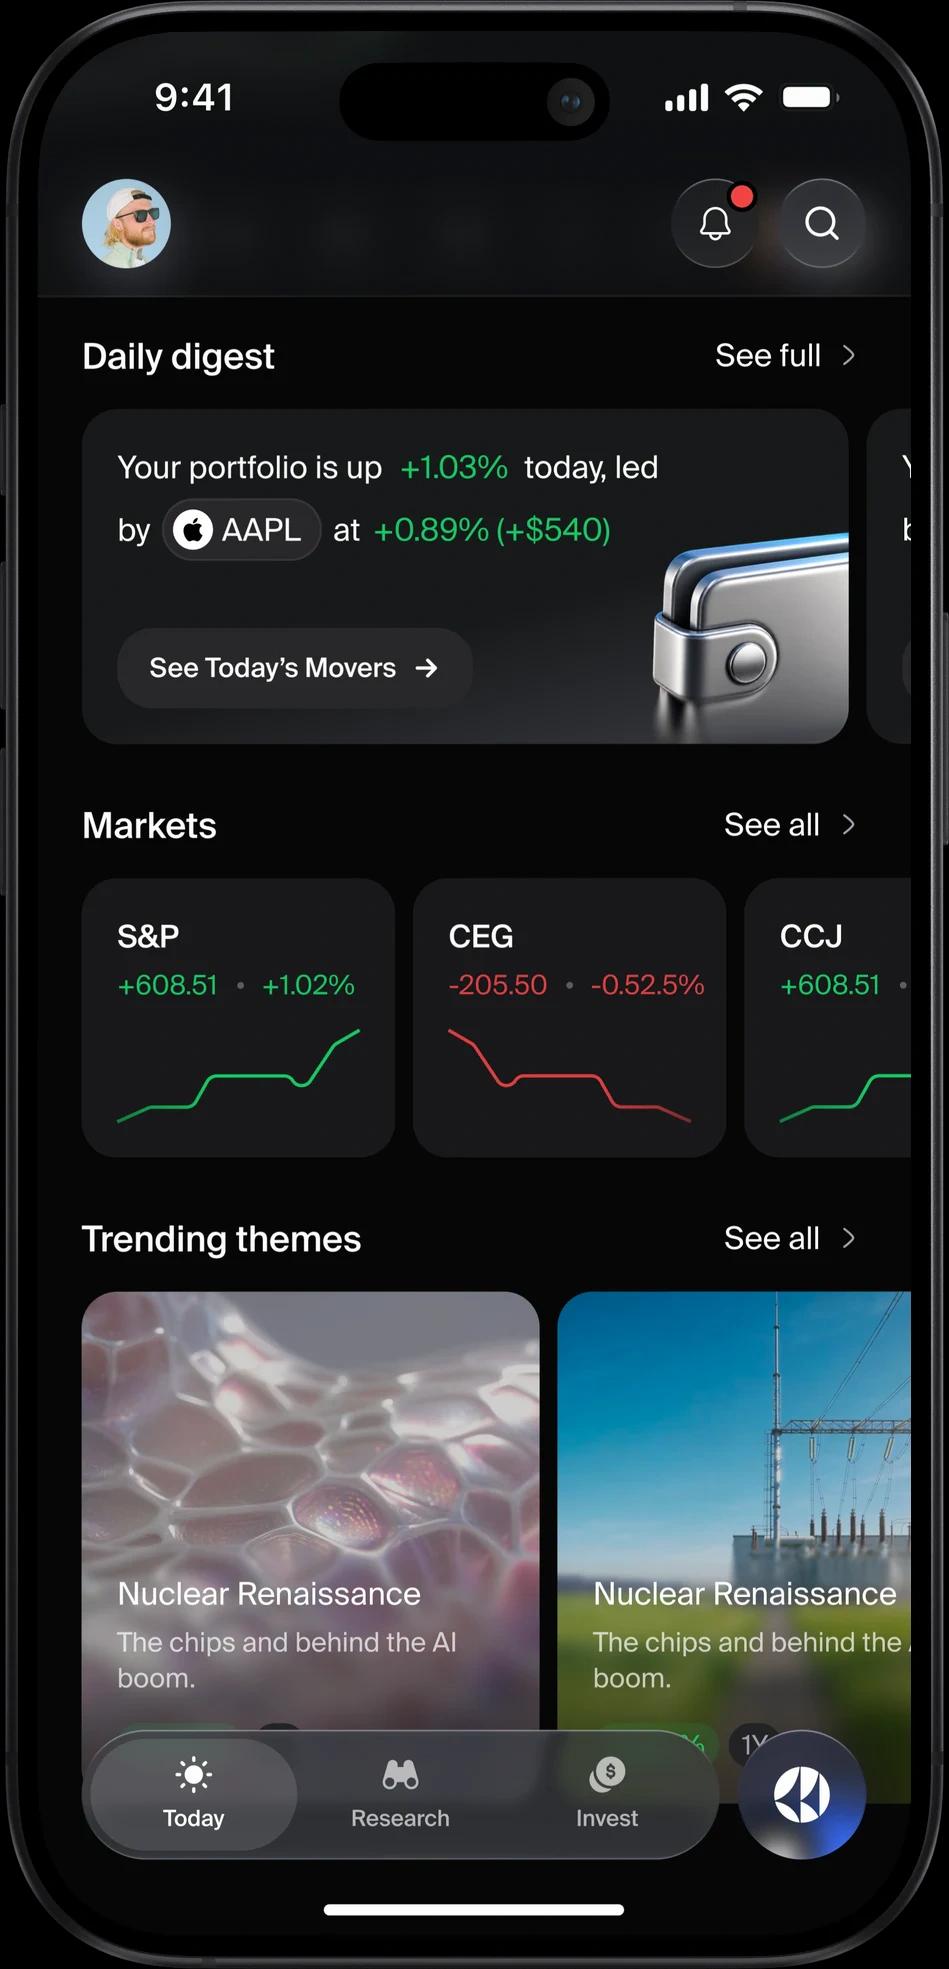
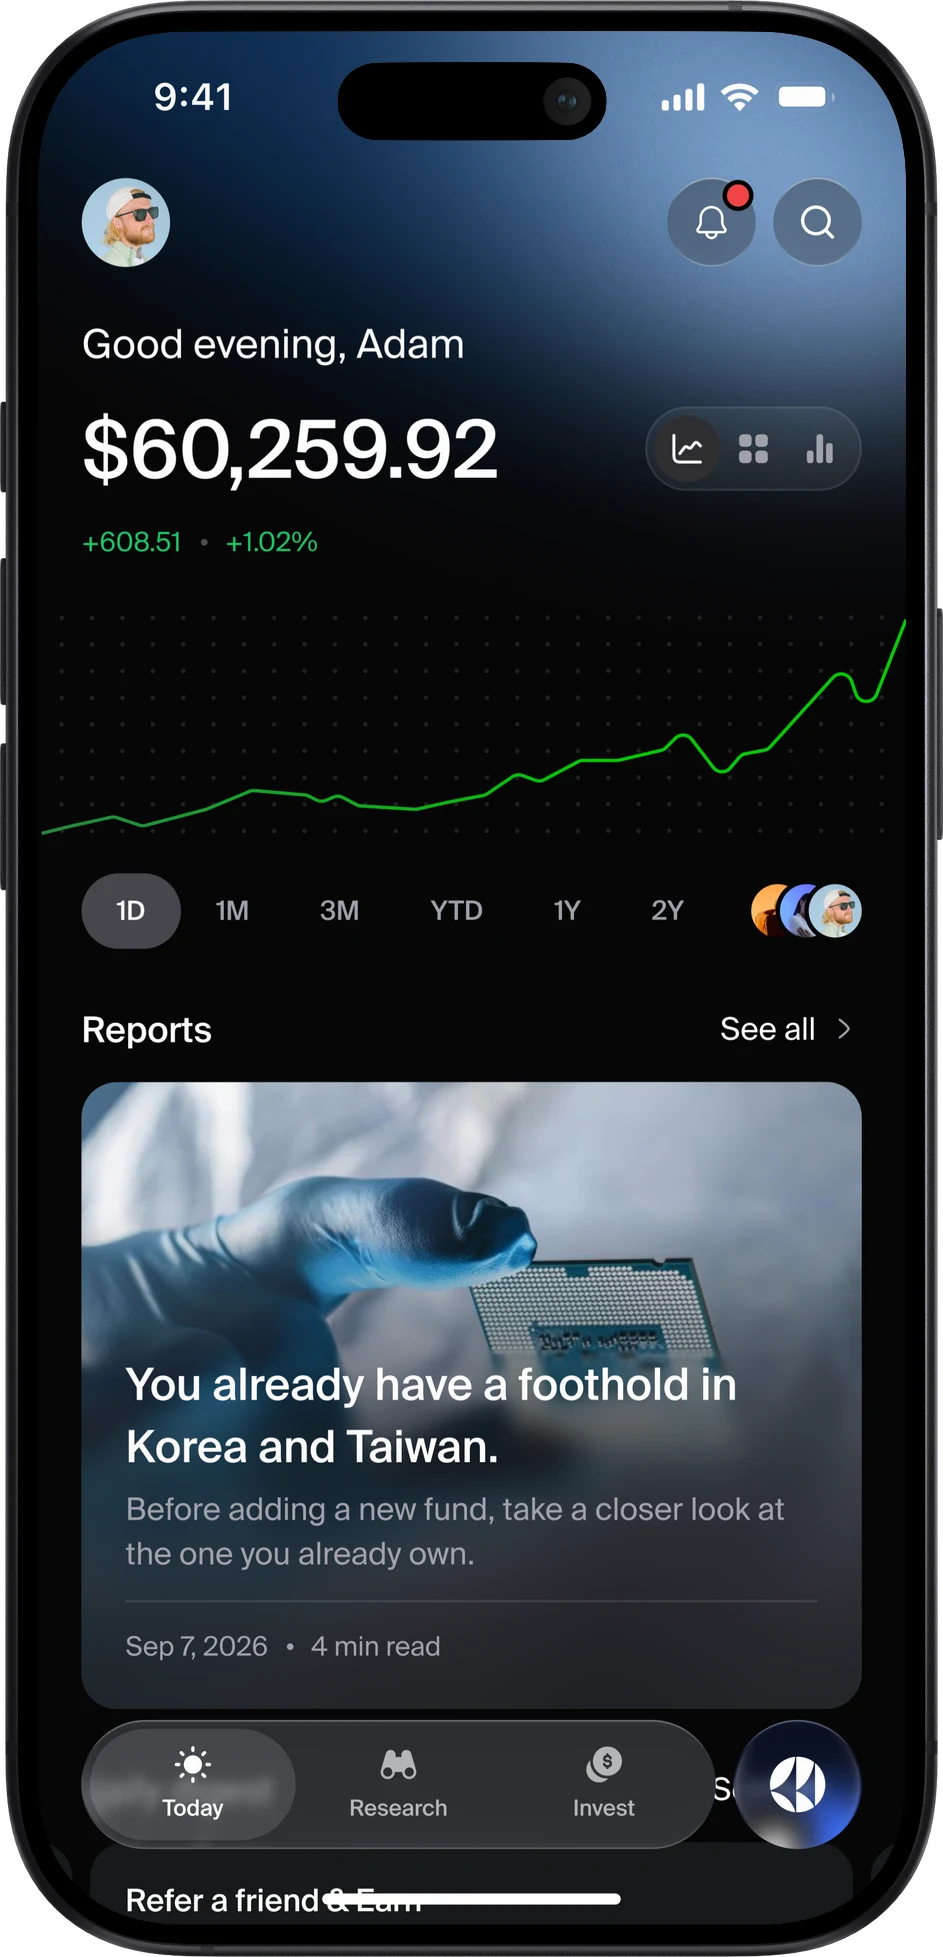
Astor does the whole-portfolio check for you, for free. Connect your brokerage, retirement and crypto accounts, like Robinhood, Schwab and Coinbase, and Astor sees every fund and stock you hold in one place. Ask whether your ETFs overlap and it compares their holdings. Ask how much of a company you really own and it looks through every ETF in every connected account, adds any shares you hold directly and breaks the total down by fund. It’s free to start with no card, and the free plan includes a limited number of questions.
Then it tells you what to do about it. Astor is an SEC-registered investment adviser, so its answers are personalized advice about what you own. If two funds track the same index, it can tell you that one of them adds nothing and which one to keep. If a few companies have crept up through several funds, it explains how concentrated you are, whether that fits what you’re trying to do and how you could bring it down, like trimming a sector fund or choosing a broader one for new money. If the overlap is a tilt you chose on purpose, it tells you that too. You make every decision.
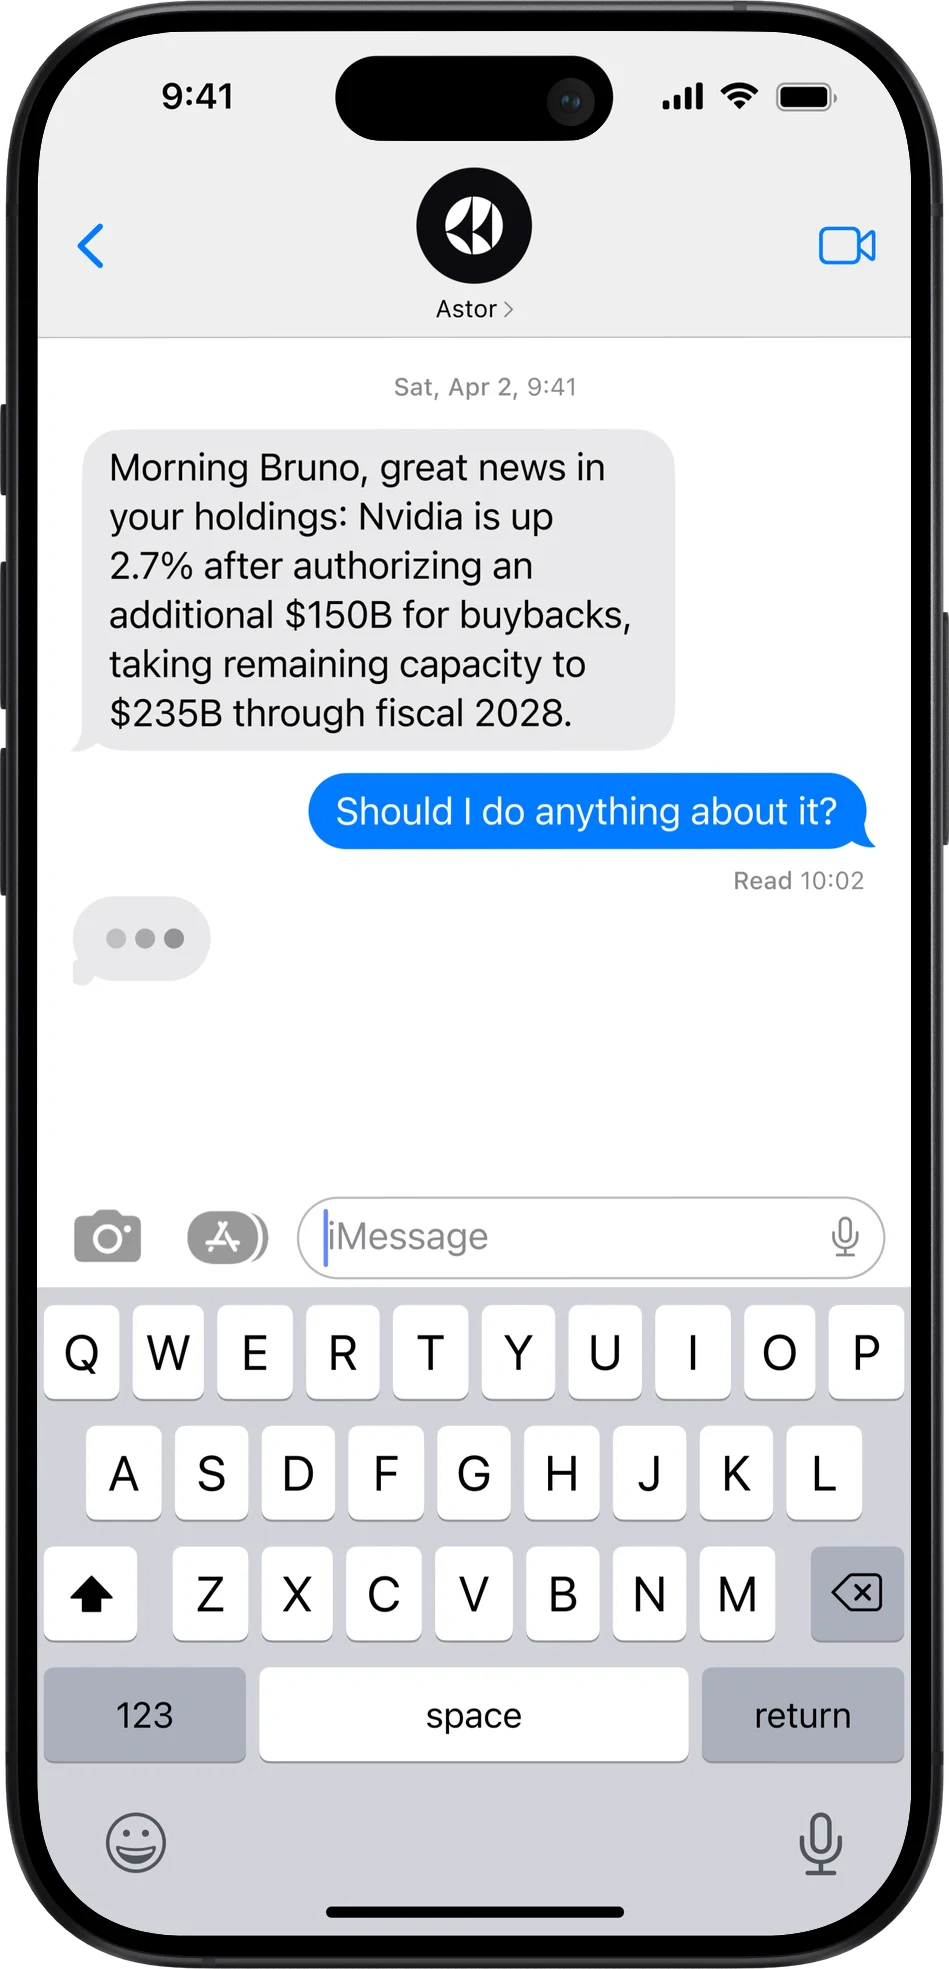
Astor also follows every position you own and texts you on iPhone, iMessage or WhatsApp when something affecting one of them crosses a line you care about. It can see your holdings but can’t move money.
| Astor | Free overlap checker | Spreadsheet | |
|---|---|---|---|
| Free to start | Yes | Yes | Yes |
| Works with your existing brokerage | Yes, at most major US institutions | You type in tickers | You enter holdings yourself |
| Overlap between two funds | Yes, for funds you own or are considering | Yes | Yes, from the funds’ holdings files |
| Your total exposure to each company | Yes, across every connected account | Not covered | Yes, with a formula per fund |
| Personalized advice on what you own | Yes, from an SEC-registered investment adviser | Not covered | Not covered |
| Watches your holdings and alerts you | Every position you own, with a text when something matters | Not covered | Not covered |
| Platforms | iPhone, iMessage and WhatsApp | Web | Any computer |
When is Astor the better fit?
If you only want to compare two funds before buying one, our free ETF overlap checker is enough. Astor fits people who hold several funds and stocks across a few accounts and want an adviser to look at all of it together. It shows how much of each company you really own, explains whether the overlap fits your plan and gives you personalized advice on what you could do next, with every decision left to you. It’s free to start, and paid plans are a flat price, never a percentage of your assets. See pricing for the details.
It has real limits too. There’s no Android or web app, and it’s US only. It doesn’t hold your money or run a managed portfolio, and it doesn’t do budgeting, tax filing or estate planning. For apps that track and explain your portfolio, see the best AI portfolio trackers, and for the wider category, the best AI investing apps.
Frequently asked questions
Is it bad to own ETFs that overlap?
No, not on its own. Overlap is a problem only when it leaves more of your money in the same companies or sector than you intended. Two funds that track the same index, though, add complexity without adding anything to your mix.
Do VOO and VTI overlap?
Yes, heavily. VOO holds the S&P 500’s 505 stocks, and VTI holds those plus about 3,000 other companies, mostly smaller ones. Because the S&P 500 covers about 80% of the US market’s value, most of VTI’s money is in the same companies as VOO.
Does overlap work the same way for mutual funds?
Yes. The same math works for mutual funds and for a mix of mutual funds and ETFs. Use the most recent holdings each fund reports and check their date, because a fund’s holdings change over time.
Can Astor check my ETF overlap?
Yes, and you can start for free. Connect your accounts, then ask whether your funds overlap or how much of a company you own, and Astor looks through every ETF across your accounts. As an SEC-registered investment adviser, it also tells you what to do if the overlap is more than you want.
Sources
- Vanguard: S&P 500 ETF (VOO) fact sheet, as of Sept 30, 2026, accessed Nov 20, 2026
- Vanguard: Total Stock Market ETF (VTI) fact sheet, as of Sept 30, 2026, accessed Nov 20, 2026
- Vanguard: Information Technology ETF (VGT) fact sheet, as of Sept 30, 2026, accessed Nov 20, 2026
- iShares: iShares Core S&P 500 ETF (IVV), accessed Nov 20, 2026
- Invesco: Invesco QQQ, accessed Nov 20, 2026
- Invesco: About Invesco QQQ, accessed Nov 20, 2026
- Nasdaq: What is the Nasdaq-100?, accessed Nov 20, 2026
- S&P Dow Jones Indices: S&P 500, accessed Nov 20, 2026
- SEC: Exchange-Traded Funds, Small Entity Compliance Guide, accessed Nov 20, 2026
- FINRA: Concentration risk, accessed Nov 20, 2026
- ETF Research Center: ETF Overlap, accessed Nov 20, 2026
Important information
Gaus, Inc. DBA Astor is an SEC-registered investment adviser (CRD #338424). Registration does not imply a certain level of skill or training. Astor provides non-discretionary advice: you make every investment decision. All investing involves risk, including the loss of principal, and past performance does not guarantee future results. Astor uses AI, which can make mistakes. This article is general information, not individualized investment, tax or legal advice. See our disclosures.
About comparisons
Information about other companies comes from their public websites and filings as of November 2026 and may have changed since; check each provider for current details. Comparisons and rankings reflect Astor’s opinion. Other companies’ names and trademarks belong to their owners, and no affiliation or endorsement is implied.
Share