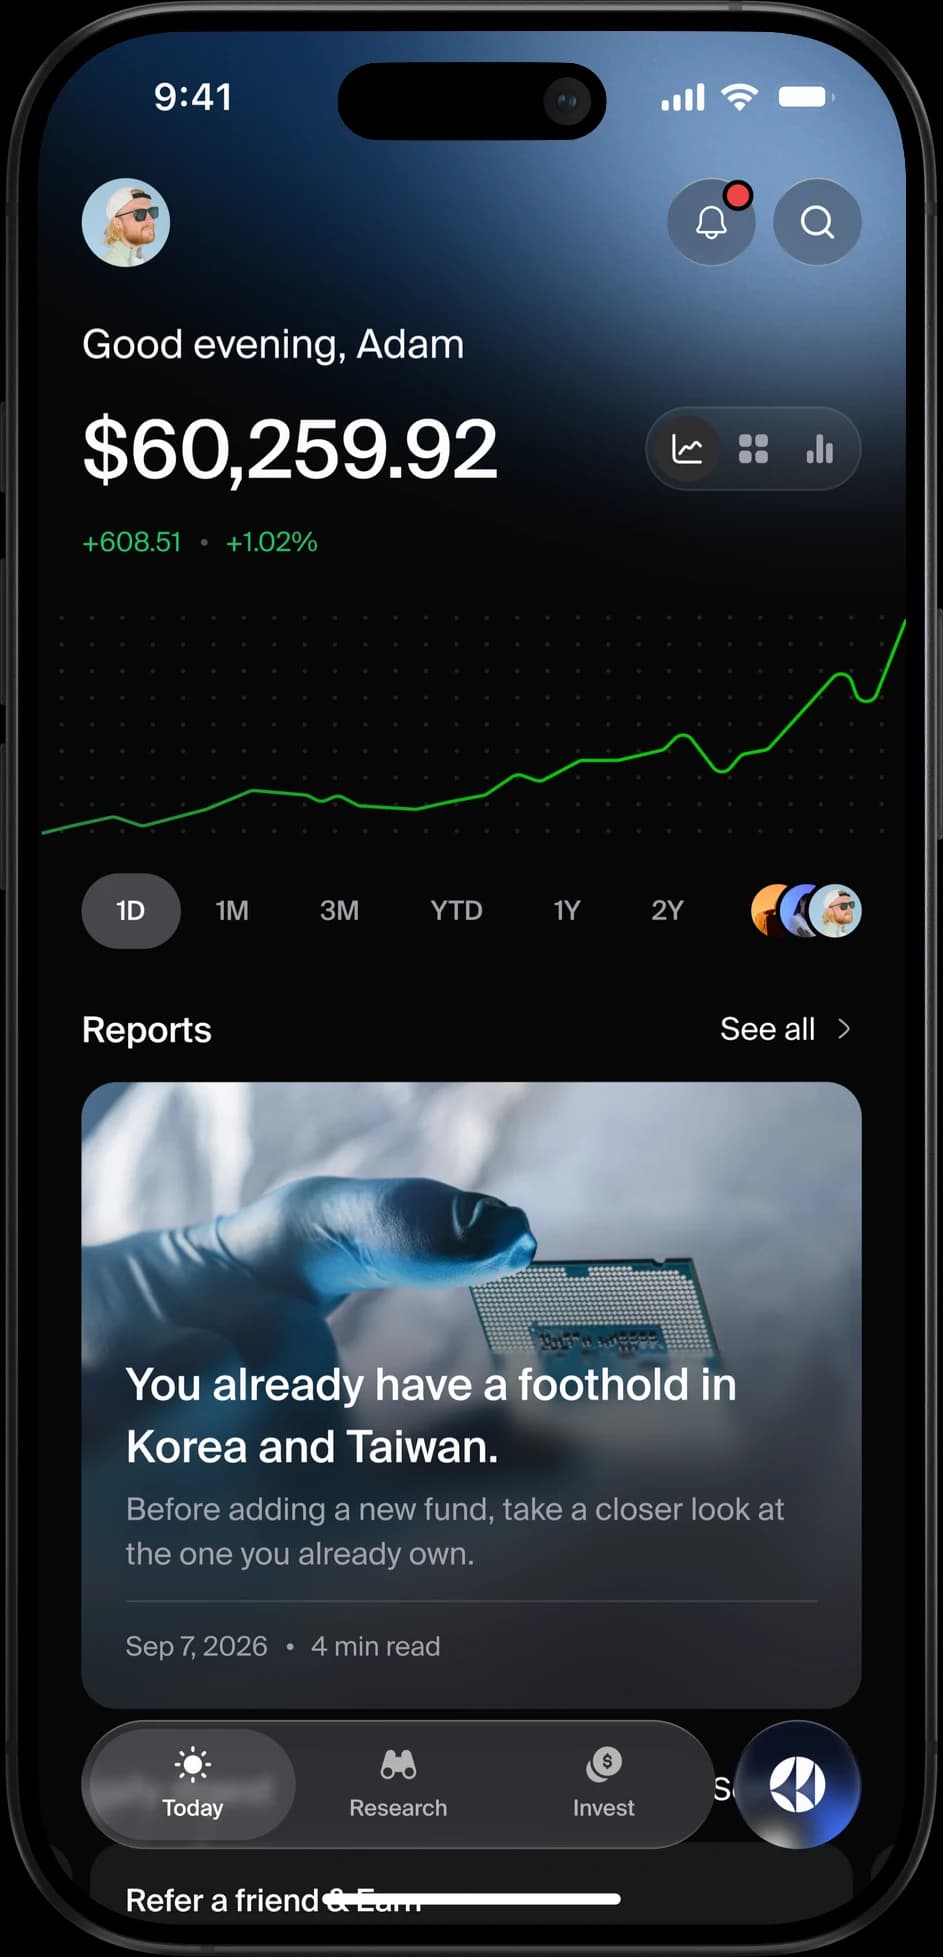
To compare your portfolio to the S&P 500, measure your own return over a period with a method that strips out your deposits and withdrawals, then set it next to the index’s return over exactly the same dates, ideally with dividends included. Astor, a personal investing agent from an SEC-registered investment adviser, runs that comparison across all the accounts you connect, then explains what drove the difference and what you could do about it.
The comparison only means something if the S&P 500 resembles what you own. If you hold bonds, international stocks or a lot of cash, you’ll want a second yardstick next to it. Below we walk through the steps, the mistakes that skew the result and the tools that do the math, with every outside fact checked on November 19, 2026.
Is the S&P 500 the right benchmark for your portfolio?
It is if most of your money sits in large US companies. S&P Dow Jones Indices calls the S&P 500 the best single gauge of large-cap US stocks, which is exactly what it measures. It doesn’t measure bonds, small companies, international stocks or cash.
Schwab makes the same point in its guide to tracking performance. It says the S&P 500 isn’t “the market,” and that a benchmark should reflect your portfolio’s risk level and allocation. FINRA’s advice is to compare apples to apples, for example a large-company stock fund against the S&P 500 and a small-company fund against the Russell 2000.
Here is how to match a benchmark to what you hold.
| If most of your portfolio is | A fair benchmark |
|---|---|
| Large US stocks | The S&P 500 |
| Small US stocks | A small-cap index such as the Russell 2000 |
| International stocks | An international index such as the MSCI EAFE |
| Investment-grade US bonds | A bond index such as the Bloomberg US Aggregate |
| A mix of stocks and bonds | A blend of indexes in the same proportions as your mix |
If you hold a 70/30 mix of stocks and bonds, comparing it only with the S&P 500 mostly tells you how stocks did against bonds. That’s useful context, but it isn’t a grade on your choices.
How do you calculate your portfolio’s return?
The number your app shows as “return” may not be the one you want. There are two common methods, and they answer different questions.
A time-weighted return measures how your investments did, with the effect of deposits and withdrawals removed. It’s the right number to set next to an index, because the index never gets a new deposit. The CFA Institute’s performance standards (GIPS) require firms to present time-weighted returns for most portfolios for this reason.
A money-weighted return, sometimes called your personal rate of return, includes the timing of your own cash flows. If you added a lot of money just before a rally, it will look better than the time-weighted number, and the reverse if you added before a drop. It answers “how did my money do,” not “how did my investments do.”
Brokerages don’t all use the same method. Fidelity says your Personal Rate of Return uses a money-weighted formula that reflects the size and timing of your trades. Robinhood says deposits and transfers are left out of its portfolio return, using a method based on the Modified Dietz formula. The quickest check is your broker’s help page on returns.
A simple change in your balance is the least useful number of all. If you started the year at $50,000, added $10,000 and ended at $66,000, the balance rose 32%, but much of that was your own deposit.
How do you make it a fair comparison?
Three details decide whether the comparison holds up.
- Use the same dates. Pick the start and end dates first and use them for both your portfolio and the index. A comparison that starts a month later for one side can flip the result.
- Include dividends on both sides. The S&P 500 level you see quoted is usually its price, which leaves out dividends. Your portfolio’s return includes the dividends you received, so the price-only index comes out lower than an investor in the index actually did. One fix is to use an S&P 500 fund’s own total return. iShares, for example, shows IVV’s total return with dividends reinvested and fund expenses taken out, and IVV’s expense ratio is 0.03%.
- Compare over years, not weeks. FINRA suggests looking over several years rather than a single quarter or even a year, because short periods can be skewed by one-off events.
Fees matter too. The SEC’s investor bulletin on performance claims notes that a benchmark may not reflect the fees and expenses you pay. If you pay an advisory fee or fund expenses, your return already has them taken out and the index doesn’t.
Which tools can compare your portfolio to the S&P 500?
The hard part for most people is that their money sits in more than one place. A 401(k) at one firm, an IRA at another and a brokerage account at a third each reports the return on its own accounts only.
- Your brokerage. Good for accounts held there, and if all your money is at one firm, its performance page already has the data and costs nothing extra. Schwab Intelligent Portfolios, for example, lets you compare performance with up to five indexes, including the S&P 500, the Russell 2000, the MSCI EAFE and the Bloomberg US Aggregate.
- A spreadsheet or open-source software. Portfolio Performance, a free open-source app for Windows, Mac and Linux, lets you add the S&P 500 as a benchmark and compare your whole portfolio or single holdings against it, using a time-weighted return or an internal rate of return. It takes more setup, and you enter or import the transactions yourself.
- Astor. It connects to the accounts you already have at most major US institutions, compares them with the S&P 500 in one view and, as a registered adviser, tells you what drove the difference, as described below.
How does Astor help you compare and act on it?
Astor is a personal investing agent on iPhone, iMessage and WhatsApp from Gaus, Inc. DBA Astor, an SEC-registered investment adviser. It connects through Plaid to the brokerage, retirement and crypto accounts you already have at most major US institutions, like Robinhood, Schwab and Coinbase, so it can see your holdings but can’t move money. Because Astor is a registered adviser, its recommendations are personalized investment advice about what you own, and it owes clients a fiduciary duty.
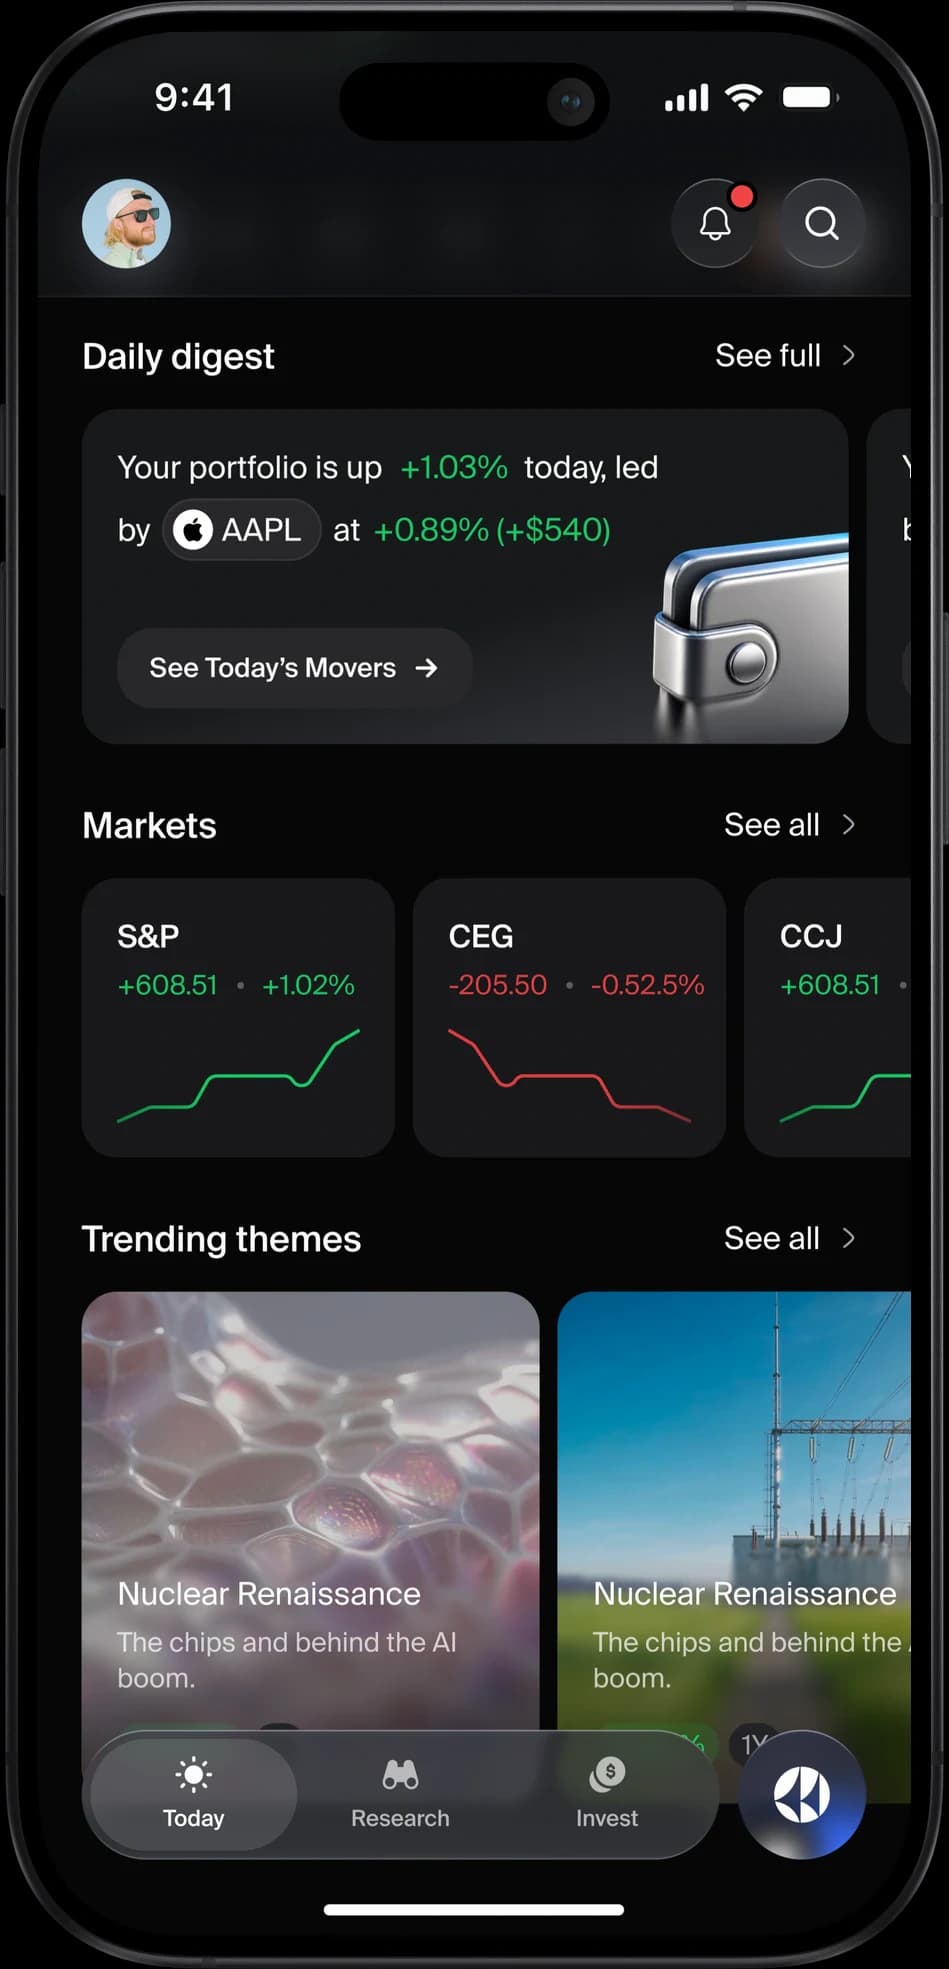
The comparison is the starting point. On the Today screen, the Benchmark comparison view sets your portfolio’s percent change across every account you connect, using a time-weighted return when it’s available, against the S&P 500 over the range you pick. You can add the Nasdaq 100, the Dow, Bitcoin or any other ticker, like a bond fund, and compare several at once. Its S&P 500 line is a price return, and filtering the chart to your investment accounts gives the closest match.
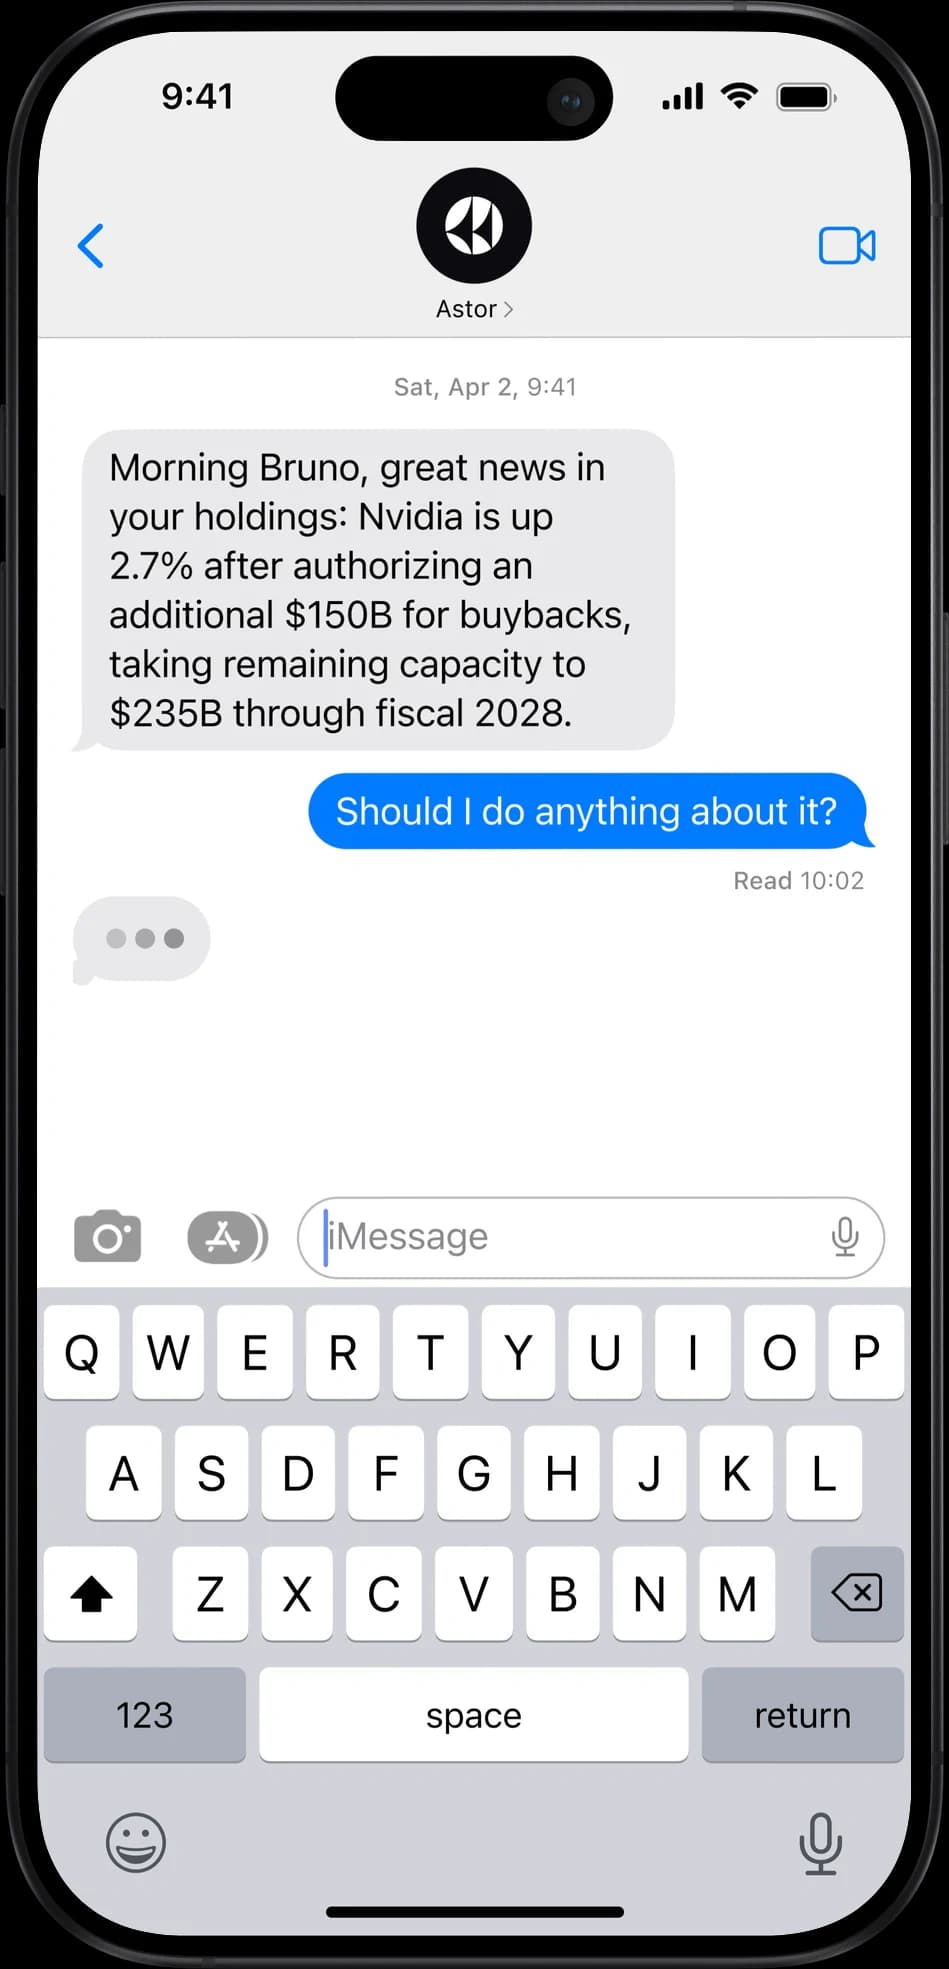
What matters more is what you do with the gap. You can ask Astor why your portfolio trailed or ran ahead of the index, and it answers from your actual holdings with live prices, news and filings, so you can see which positions or sectors drove the difference. It follows every position you own and texts you what happened, why it matters to you and what you could do. You make every decision.
| Astor | Your brokerage | Portfolio Performance | |
|---|---|---|---|
| Free to start | Yes | Yes, for accounts there | Yes, free software |
| Works with your existing brokerage | Yes, at most major US institutions | Its own accounts | Yes, from transactions you enter or import |
| Compares with the S&P 500 | Yes, plus any ticker you add | Varies by firm | Yes, with any index you add |
| Explains what drove the difference | Yes, from your actual holdings | Varies by firm | Charts and reports you read yourself |
| Personalized advice on what you own | Yes, from an SEC-registered investment adviser | Through some firms’ advice services | Software for your own analysis |
| Watches your holdings and alerts you | Every position you own, with a text when something matters | Varies by firm | Tracks the transactions you enter or import |
| Platforms | iPhone, iMessage and WhatsApp | Varies by firm | Windows, Mac and Linux |
When is Astor the better fit?
Astor fits people who pick their own stocks and ETFs across a few accounts and want an adviser on their side, not just a chart. It looks at everything you own across the accounts you connect, shows how it compares and why, and gives you personalized advice on what you could do next, with every decision left to you. When something crosses a line you care about, it texts you what happened and why it matters to you, in the app, in iMessage or on WhatsApp. It’s free to start, and paid plans are a flat price, never a percentage of your assets. See pricing for the details.
It has real limits too. There’s no Android or web app, and it’s US only. It doesn’t hold your money or run a managed portfolio, and it doesn’t do budgeting, tax filing or estate planning. For a full portfolio checkup beyond returns, see how to review your investment portfolio, and for other tracking apps, see the best AI portfolio trackers.
Frequently asked questions
Should I compare my portfolio to the S&P 500?
Yes, if your portfolio is mostly large US stocks. If you also hold bonds, international stocks or small companies, keep the S&P 500 as one reference and add a benchmark for each of those parts.
What’s the difference between time-weighted and money-weighted return?
A time-weighted return removes the effect of your deposits and withdrawals, so it shows how your investments did and is the one to compare with an index. A money-weighted return includes the timing of your cash flows, so it shows how your own money did.
Does the S&P 500’s return include dividends?
No, not the widely quoted level. That number is the price, which leaves dividends out. Some sources publish a total-return version, and an S&P 500 fund’s total return, like the one iShares shows for IVV, reinvests dividends and takes out the fund’s expenses.
How often should I compare my portfolio to the S&P 500?
Once or twice a year is plenty for most people. FINRA suggests judging over several years, because a single quarter or year can be skewed by one-time events.
Can Astor compare my portfolio to the S&P 500?
Yes. Astor’s Today screen has a Benchmark comparison view that sets your portfolio’s percent change across the accounts you connect against the S&P 500 and other tickers you choose, and you can ask it what drove the difference.
Sources
- S&P Dow Jones Indices: S&P 500, accessed Nov 19, 2026
- Charles Schwab: Keeping Track of Your Portfolio’s Performance (May 29, 2026), accessed Nov 19, 2026
- FINRA: Get Off the Bench, A Look at Benchmarks (May 9, 2023), accessed Nov 19, 2026
- SEC Investor.gov: Investor Bulletin, Performance Claims, accessed Nov 19, 2026
- CFA Institute: Overview of the Global Investment Performance Standards, accessed Nov 19, 2026
- Fidelity: Important information about your portfolio summary, accessed Nov 19, 2026
- Robinhood: Using charts, accessed Nov 19, 2026
- Portfolio Performance: Home, accessed Nov 19, 2026
- Portfolio Performance: Benchmarking, accessed Nov 19, 2026
- iShares: iShares Core S&P 500 ETF (IVV), accessed Nov 19, 2026
- SEC Investment Adviser Public Disclosure: Gaus, Inc. DBA Astor, accessed Nov 19, 2026
Important information
Gaus, Inc. DBA Astor is an SEC-registered investment adviser (CRD #338424). Registration does not imply a certain level of skill or training. Astor provides non-discretionary advice: you make every investment decision. All investing involves risk, including the loss of principal, and past performance does not guarantee future results. Astor uses AI, which can make mistakes. This article is general information, not individualized investment, tax or legal advice. See our disclosures.
About comparisons
Information about other companies comes from their public websites and filings as of November 2026 and may have changed since; check each provider for current details. Comparisons and rankings reflect Astor’s opinion. Other companies’ names and trademarks belong to their owners, and no affiliation or endorsement is implied.
Share